BESS as Grid Infrastructure: Why Battery Storage is Changing the Rules of the Game in the Energy Market

Europe has a grid problem. 40% of power grids are over 40 years old. The need for renovation is estimated at EUR 584 billion by 2030. At the same time, the expansion of renewable energy is growing faster than any grid planning can react — over 800 GW worldwide in 2025 alone.

And then there are the new loads: electrolysis, data centers, e-mobility. Local overload situations arise faster than copper can be laid. Planning lead times for line expansion: 5 to 10 years. The infrastructure is lagging behind reality.

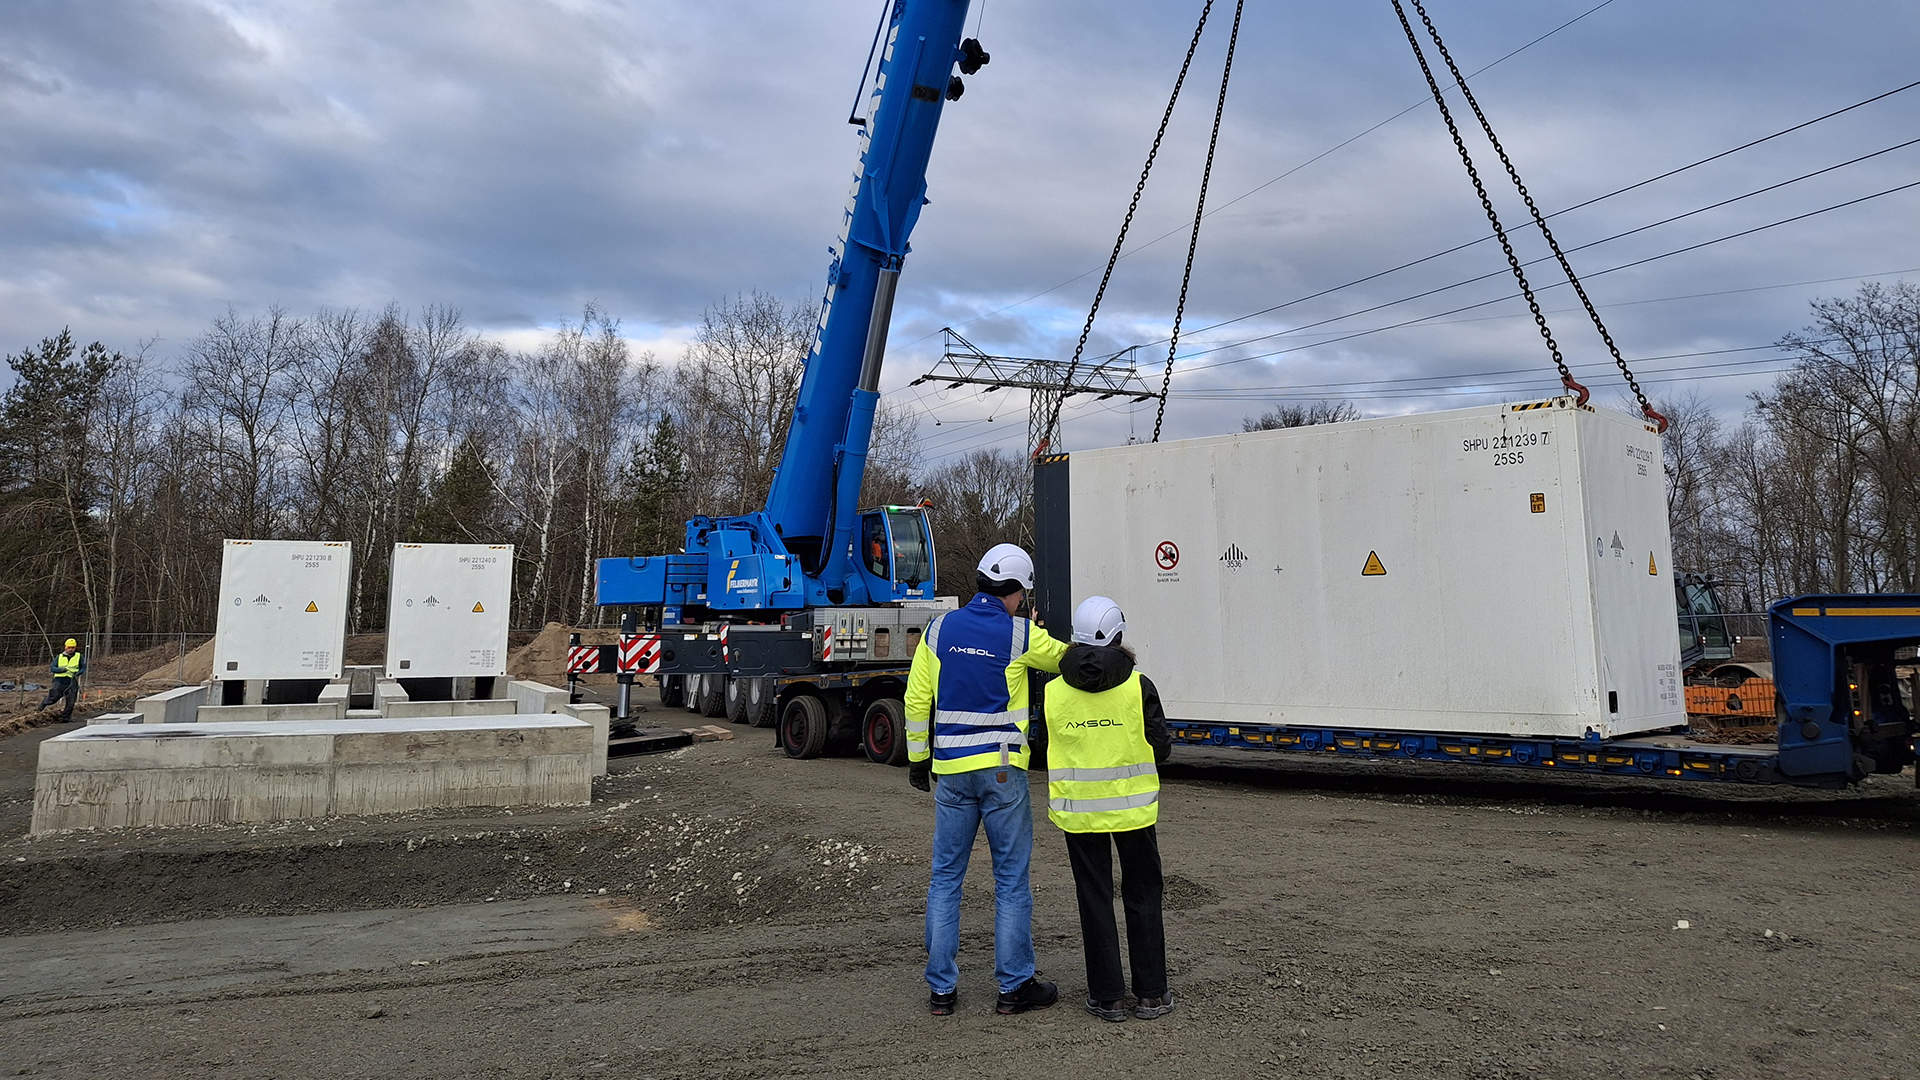
Battery storage stands in this gap. Not as passive energy buffers — but as active grid infrastructure.

BESS is not a trade product. BESS is infrastructure.

Most market observers view battery storage as flexibility providers in the electricity market — revenues from FCR, aFRR, arbitrage. This is correct, but it is only half the truth.

A battery storage system actively interacts with the grid state. It takes over functions for which physical grid expansion would otherwise be necessary:

  • Peak Shaving: Relieving lines during peak load times — delays or reduces line expansion
  • Congestion Relief: Local buffering during bottlenecks in the distribution grid — can replace individual line reinforcements
  • Frequency Regulation (FCR/aFRR): System stabilization without physical grid upgrading
  • Voltage Support: Local reactive power control — reduces the need for reactive power compensation systems
  • Grid-Forming (VSM-Mode): Synthetic inertia with a high share of renewables — system-relevant during the decommissioning of conventional power plants

Each of these functions substitutes or delays infrastructure capital. This makes BESS not a market participant — but an infrastructure provider.

What BESS cannot do — and why that strengthens the thesis

An honest assessment: Battery storage systems buffer energy over time. They do not shift it spatially. Where there is physically too little transport capacity between generation and load, storage does not help. Physical grid expansion remains irreplaceable in these cases.

Empirical analyses based on NREL and EPRI data show a nuanced picture:

ScenarioShare of grid expansion situations
BESS as a full alternative15–30%
BESS enables delay of 5–15 years30–40%
Physical grid expansion irreplaceable30–55%

The numbers show: BESS does not replace all grid expansion. But in up to 70% of cases, a battery storage system can either completely replace the expansion or delay it by years. This is not a niche argument. This is a systemic lever.

The chain of effect: How structural bargaining power arises

This is where it becomes strategically relevant. The logic is simple — and that is exactly why it is so powerful:

Step 1: A grid operator has a bottleneck. They face two options.

Option A: Expand the line. Expensive, 5–10 years planning lead time, regulatorily complex.

Option B: A neighboring BESS takes over the relief function. Immediately available, cheaper, scalable.

Step 2: As long as Option B works, the investment in Option A is eliminated. The grid operator saves capital and time.

Step 3: If the BESS is removed, the grid operator must expand immediately and under time pressure.

The result: The grid operator has a structural interest in the BESS staying — and remaining available. This is not a market transaction. This is a dependency. And from dependency arises bargaining power.

Which levers result from this

From this structural position, opportunities arise that are not yet systematically utilized today:

Long-term capacity contracts with grid operators — analogous to redispatch contracts. The BESS delivers a defined relief performance, and the grid operator pays for availability. Predictable for both sides.

Grid service remuneration for measurable relief behavior. Not just balancing energy, but an independent remuneration for the infrastructure service that the BESS provides.

Preferred grid connection conditions and feed-in priorities. Those who offer the grid operator an alternative to line expansion have a strong argument for better connection conditions.

Influence on location decisions for new transmission lines. BESS locations with proven relief effects change the planning of grid expansion measures.

Why timing is crucial now

The described bargaining power exists technically. Regulatorily, it is not yet priced in. This is precisely where the window of opportunity lies.

MarketStatus today
GermanyNo dedicated grid relief remuneration for BESS. §14a EnWG opens initial approaches, but no structured regime.
United KingdomConstraint Management and STOR programs active. BESS is remunerated as a Non-Wires Alternative (NWA).
USA (CAISO, PG&E)NWA programs established since 2020. Structured tender regime for grid alternatives.
EU FrameworkSmart grids and flexibility in focus. Regulation follows — likely 2026–2029.

In Germany, the NOVA principle (Grid Optimization before Reinforcement before Expansion) already exists as a regulatory requirement. Grid operators are obliged to examine alternatives to physical grid expansion before laying copper. The framework is there — the remuneration structures are still missing.

Experience from the UK and the USA shows: Regulation follows technical reality — with a 3 to 5-year delay.

The strategic gap: Those who build the infrastructure today, provide the measurement data, and can prove the grid relief will be at the table when the remuneration frameworks are negotiated.

Three conditions for the lever to take effect

Bargaining power does not arise automatically. Three prerequisites must be met:

1. Transparency: Measurable grid utility

The grid operator must be able to transparently evaluate the relief performance of the BESS. This requires an energy management system that not only controls but also documents — audit-proof, in real-time, with reliable data.

2. Timing: Infrastructure before regulation

The remuneration frameworks for grid services do not yet exist in Germany. But those who want to use them must have built the infrastructure beforehand. Build today, negotiate tomorrow — not the other way around.

3. Verifiability: Ability to account for relief

The ability not only to provide grid utility but also to prove it in a structured way and translate it into contractual formats will become a differentiator. Pure spot providers without data infrastructure will not be able to take this step.

The Framing Shift: From Flexibility to Infrastructure

The decisive change in market perspective:

Previous FramingNew Framing
BESS as a flexibility provider in the electricity marketBESS as system-critical grid infrastructure
Revenues from FCR/aFRR arbitrageStructural relief performance with infrastructure value
Competition in energy marketsPartnership with grid operators
Project businessPlatform with long-term system relevance

This shift changes more than just communication. It changes valuation. A BESS positioned as infrastructure has a different risk assessment than a pure trading asset. Bankable revenue streams through grid service contracts instead of spot market volatility.

For investors, this means: NWA contracts, as already established in the UK and the USA, create the precedent for future remuneration frameworks in Germany and Europe.

What this means for BESS operators

The core statement is specific enough to translate into a strategy:

BESS does not make copper more expensive — BESS makes copper dispensable as long as BESS is present.

That is structural bargaining power. And those who build it today will determine the conditions tomorrow.

The 2026–2030 window of opportunity is open. Regulation in Germany and large parts of Europe lags 3–5 years behind technical reality. Those who build system relevance, provide data, and establish partnerships with grid operators in this window will sit at a structurally different negotiating table in 2029/2030 — with long-term contracts instead of short-term arbitrage.

The solution via pure line expansion is too expensive, too slow, and politically too complex. Battery storage systems close this gap — but only for operators who build the right infrastructure today and are able to transparently prove their system performance.

TCO over 15 Years: Why CAPEX Alone Doesn’t Tell the Whole Business Case

When municipal utilities negotiate for a battery storage system, the first question is almost always the same: “What does the system cost?”

It’s an understandable question. The investment sum is tangible, comparable, and appears as a clear figure in the offer. But it is also the most misleading key figure in the entire BESS business case.

What determines whether your storage project is still profitable in year 10 is not the costs on the day of commissioning. It is OPEX, degradation, augmentation, and WACC — factors that are rarely included in the offer but significantly shape the business case over 15 years.

This article explains which cost blocks require a complete TCO picture, where the typical blind spots lie — and why the financial buyer ultimately needs a stress-tested business case with reliable scenarios, not a promise of returns.

What Municipal Utilities Typically Calculate for Investment Sums — and What They Overlook

The CAPEX calculation for a BESS project appears complete at first glance: battery containers, power electronics (PCS), transformer, grid connection costs, engineering, and commissioning. Some calculations also include permitting costs and initial spare parts.

What is regularly underestimated:

Grid connection costs as an uncertainty item. The actual costs for grid connection and substation are rarely precisely plannable at the start of a project. Grid operator requirements, cable length, and transformer sizing can cause real connection costs to deviate significantly from the initial estimate. Those who plan with too narrow a CAPEX corridor here will face their first stress test even before construction begins.

Ancillary project costs and internal expenses. External project managers, internal capacities for tendering and awarding contracts, legal advice for EPC contracts — these positions are real but rarely fully included in the initial budgeting.

Reserves for cost increases. Fluctuations in material costs, extended delivery times, or construction delays are not uncommon in infrastructure projects. A TCO model that does not include a sensitivity analysis over the CAPEX corridor (e.g., ±15%) is out of touch with reality.

In short: CAPEX is not a single figure — it is a distribution. Ignoring this provides controlling with a false sense of accuracy.

OPEX Predictability: The Silent Cost Drivers Over 15 Years

While CAPEX is a one-time expense, OPEX costs impact profitability year after year. Over a 15-year operating period, they add up to a significant portion of total costs — and are often set too optimistically in the initial business case.

Overview of relevant OPEX blocks:

O&M (Maintenance and Troubleshooting). Regular maintenance intervals, remote monitoring, response times for malfunctions — these are contractual services that come at a price. A well-structured O&M contract with clear SLAs (e.g., remote troubleshooting ≤2 hours, on-site service ≤24 hours) creates predictability. A poorly structured contract creates cost uncertainty during ongoing operations.

Insurance. Battery storage systems are high-value assets with specific risk profiles. Adequate property insurance (including business interruption) is necessary, but premiums are rarely included in the initial business case model.

Grid fees and auxiliary power. Self-consumption for air conditioning, control, and monitoring runs all year. Depending on the location and grid situation, changes in grid fee systematics (AgNes regulation) from 2029 onwards could additionally influence the OPEX calculation. A robust business case includes at least two scenarios for this.

Monitoring and Reporting. Operational transparency is not a luxury — regular performance reporting is standard for board resolutions, banks, and internal control. The costs for this are low but must be consistently considered.

A typical rule of thumb: OPEX over the lifetime is in the order of 1.0–2.0% of CAPEX per year — depending on system size, contract model, and location. For a medium-sized BESS project, this can account for a significant portion of total costs over 15 years. Underestimating this position optimizes the business case on paper — not in reality.

Degradation: When Capacity Declines — and When Augmentation Becomes Necessary

A battery storage system is not a static asset. Every charge and discharge cycle, every temperature fluctuation, every hour of operation leaves traces in its capacity. This effect is called degradation — and it is the most frequently underestimated factor in BESS business cases.

What degradation specifically means: LFP batteries (lithium iron phosphate), today the standard for large stationary storage, typically lose between 1.5% and 3% of their usable capacity per year. After ten years, the usable capacity can therefore be significantly below the nominal value — which has direct implications for achievable revenues.

The revenue effect. Anyone who needs to maintain a certain capacity for FCR prequalification requires a minimum capacity. Falling below this threshold means losing prequalification — and thus a central revenue driver. A business case model that assumes the same revenues in year 12 as in year 1 is not a model — it is wishful thinking.

When augmentation becomes economical. Augmentation means replacing or supplementing battery modules to restore capacity to the required level. When this step makes sense depends on the CAPEX for retrofitting, the lost revenues due to capacity loss, and the system’s technical options. Modular BESS systems — like AXSOL’s ECS platform — significantly facilitate augmentation because a full migration is not necessary.

What must be in the business case. Degradation is not an unknown — it can be modeled. A robust TCO model shows the capacity path over 15 years, quantifies the revenue effect, and defines the decision point for augmentation (including CAPEX reserve).

Sensitivity Analysis: Tornado Analysis Instead of Point Forecast

The most common mistake in a BESS business case is not a wrong number — it’s a wrong presentation. Presenting controlling with a single return metric (e.g., “IRR: 7.2%”) provides a point forecast. Point forecasts are misleading in infrastructure projects because they suggest certainty where there is none.

What the financial buyer actually needs is a sensitivity analysis — and the tool for this is called Tornado Analysis.

How a Tornado Analysis works in the BESS context:

The most important input variables are varied individually (typically ±10–20%), while all others remain constant. The result shows which variable has the greatest impact on profitability — visualized as horizontal bars, ordered by leverage (hence: Tornado).

Typical variables for municipal utility BESS:

VariableWhy relevant
CAPEXOffer price, grid connection deviations, cost increases
Revenue level FCR/aFRRMarket saturation, competition, volatility
OPEXContract structure, energy prices, insurance
Degradation rateCell technology, operating strategy, air conditioning
WACCInterest rate development, equity ratio, refinancing conditions
Grid fee systematics from 2029AgNes regulation, regulatory uncertainty

The result of a Tornado Analysis is not a reassuring statement. It is an honest one: “Here are the three levers that most strongly influence your business case. And here are the scenarios under which it still works — and under which it does not.”

“What happens to our business case if revenues fall or grid fees change from 2029?”
We hear this question frequently. The answer is not: “Don’t worry.” The answer is: “Let us show you the three stress scenarios — and at what revenue level the project is still profitable.”

What the Financial Buyer Really Needs: Not a Promise of Returns, but Robustness

The financial buyer — CFO, controlling, strategy — does not need optimistic projection charts. They need a model that they can defend before the supervisory board without exposing themselves.

This specifically means:

Three scenarios, not one. Base Case (most probable assumptions), Downside Case (conservative revenues, increased costs, worse degradation), and Worst Case (combined stress across all significant variables). Anyone who only presents the Base Case is providing advertising, not an investment memo.

Break-even analysis. At what revenue level — e.g., FCR price in €/MW/h — does the project become unprofitable? This threshold makes the business case suitable for committees because it defines concrete monitoring points.

TCO predictability as a contractual requirement. A fixed-price EPC contract limits CAPEX risk. A long-term O&M contract with defined SLAs and a transparent price structure limits OPEX risk. Guarantee packages for availability, performance, and capacity — issued by a German GmbH as a contractual partner — create bankable collateral.

Augmentation as a planned option, not a surprise. Anyone who knows that augmentation costs may arise in years 10–12 and plans CAPEX reserves for them demonstrates commercial maturity. Ignoring this risks a recalculation at an unfavorable time.

The difference between a business case that passes through committees and one that fails rarely lies in the level of expected returns. It lies in the quality of uncertainty modeling.

Conclusion: TCO is Not a Cost Problem — It’s a Transparency Problem

CAPEX is the most visible element of the BESS business case. But it is not the decisive one. What determines the economic viability of a project over 15 years is the overall TCO predictability: CAPEX corridor, OPEX structure, degradation path, augmentation strategy, and a stress-tested scenario model.

A battery storage system evaluated solely on the basis of its investment sum is like a building evaluated only on its construction costs — without heating, maintenance, and insurance over its useful life.

Anyone preparing a BESS business case that stands up to supervisory boards and banks does not start with comparing offers. They start with their own load data — and model a TCO path from it that shows scenarios instead of point forecasts.

We take the first step together: A load profile analysis forms the basis for every robust TCO business case — free of charge and without obligation.

Request load profile analysis →

BESS Business Case: Controllable Value Creation for Your Municipal Utility

The most common question we hear from municipal utilities is not: “Is a battery storage system worthwhile?” It is: “How robust is the economic calculation—and what risk are we taking on?”

That is the crucial difference. Those who only ask about ROI think in point forecasts. Those who ask about predictability and risk corridors think like serious investors. It is precisely this second perspective that determines whether a BESS project passes the supervisory board—or fails because of it.

This article maps the three central economic levers of a battery storage system, ranks them by predictability, and shows which role model typically fits which municipal utility size and risk appetite.

What “controllable value creation” means for your municipal utility

“Controllable value creation” is not a marketing term—it refers to something precise: the part of the BESS business case that you can secure with your own data, independent of market price developments or regulatory changes.

What this means in concrete terms depends on your municipal utility size:

Small municipal utility (<€500 million annual revenue): Controllable value creation here primarily means grid relief and security of supply—levers that can be directly measured and planned using your own load profile. The critical question is not “What does FCR yield?” but rather: “How much demand charge reduction is realistic based on our load curve data?”

Medium-sized municipal utility (€500 million–€2 billion): Structured flexibility marketing comes into play here. A dedicated battery storage project with an external asset manager or optimizer enables systematic access to balancing energy markets (FCR, and depending on project setup, also aFRR)—with foreseeable revenue corridors based on historical market data.

Large utility (>€2 billion): Multi-asset strategy, portfolio optimization, in-house trading expertise. Controllable value creation here means hedging market risks strategically—for example, through a PSA (Power Sales Agreement) that secures a minimum revenue while selected marketing windows remain open for upside.

Common to all three: The most predictable lever is always the one based on your own data.

The three revenue levers—ranked by predictability

A battery storage system unlocks multiple revenue sources simultaneously. What matters is how reliably these sources can be calculated in advance.

Lever 1: Grid charge optimization—directly measurable

Demand charges account for 30–50% of grid charges at many municipal utilities. A battery storage system can shave load peaks and thereby reduce the demand component—based on your own load curve data. The savings potential can be precisely modeled before project start: not a scenario, not an assumption, but a calculation using your measured values.

This lever is not spectacular, but it is bankable—it can be documented with historical consumption data and creates the stable base revenue of any business case.

Lever 2: Balancing energy marketing—historically verifiable, but volatile

FCR (primary control reserve), and depending on project setup also aFRR, is the best-known revenue path for battery storage systems. Historical EPEX data allow modeling of revenue corridors—but: markets change. FCR prices have shifted significantly in recent years.

For a robust business case, this means: balancing energy markets belong in the sensitivity analysis, not in the base case. A stress test that still shows a positive net present value with a 30% revenue decline is more meaningful than an optimistic point forecast.

Lever 3: Avoided grid expansion—CAPEX comparison

Those who avoid or postpone grid expansion through a battery storage system achieve an indirect economic benefit: The CAPEX comparison between cable expansion and BESS investment often shows that the storage system is the more cost-effective solution—while additionally offering revenue potential that conventional grid expansion does not deliver.

This lever is the most difficult to monetize, but in many grid planning scenarios it is the strongest strategic argument before the supervisory board.

TCO predictability: Why the investment sum does not determine the business case

The most common question about the BESS business case is: “What does it cost?” The right question is: “What does it cost over the entire lifetime—and how do revenues and costs develop in different scenarios?”

Total Cost of Ownership (TCO) over 15 years includes:

  • CAPEX: Acquisition, installation, grid connection—the most visible, but not the sole decisive part
  • OPEX: Maintenance, insurance, monitoring, control center access, grid charges for internal consumption
  • Degradation: Capacity loss over the lifetime—typically 2–3% p.a. for LFP technology
  • Augmentation: When must capacity be retrofitted to maintain revenue profiles?
  • WACC: Financing costs and return requirements of your municipal utility

The core: Those who only optimize CAPEX are planning blind. An offer with a low list price but high OPEX costs and no clear augmentation option can be more expensive over 15 years than a higher initial investment with a transparent TCO structure.

For the financial buyer, this means: The business case must be presented as a sensitivity model. A tornado analysis covering CAPEX deviation, revenue decline, degradation rate, and WACC shows which assumptions most strongly influence the result. This is not uncertainty—this is methodological rigor.

Role models as an economic framework

How much risk your municipal utility wants and can bear determines the right business case more than the technology choice. Four role models are available:

Role ModelRisk ProfileRevenue PotentialInternal Effort
Contracting / JVVery lowLowMinimal
PSA (Power Sales Agreement)LowLow–MediumLow
Ownership + OptimizerMediumMedium–HighMedium
In-house OperationHighHighHigh

Contracting / JV: An external partner finances, builds, and operates—the municipal utility provides land and grid connection, receives usage rights or a stake. No CAPEX, minimal risk, but also little operational control.

PSA (Power Sales Agreement): A marketer takes over the storage project and guarantees the municipal utility a minimum revenue—the upside remains with the marketer. Maximum predictability with moderate returns.

Ownership + Optimizer: The municipal utility invests, an external asset manager handles ongoing marketing optimization. Full owner returns with limited internal operational effort.

In-house operation: The municipal utility assumes full responsibility—from investment to balancing energy marketing. Highest return potential, but also highest know-how and resource requirements.

Classification framework: Which model fits your municipal utility?

No two municipal utilities are alike. But three factors determine which role model typically fits best:

  1. Internal capacity: Do you have an in-house team that understands and can operate balancing energy markets?
  2. Grid connection status: Is a suitable grid connection realizable in the foreseeable future—or is the grid connection the actual bottleneck?
  3. Risk appetite: Which downside scenario is acceptable for your municipal utility without jeopardizing political and economic support?

Small municipal utility, low risk appetite: Contracting or PSA. No dedicated BESS team required—but full participation in the energy transition.

Medium-sized municipal utility, medium risk appetite: Ownership + Optimizer. Own asset, external knowledge provider, board resolution based on a clear TCO analysis.

Large utility, high risk appetite and in-house trading expertise: In-house operation with multi-asset strategy.

Important: The right entry point is not the “best” business case on paper—but the one that can actually be implemented in your organization and gains approval from internal boards.

Conclusion: Controllable value creation begins with your data

A BESS business case is not decided by the current market price for FCR—but by the quality of the data foundation, the choice of the right role model, and a TCO analysis that remains robust even under unfavorable scenarios.

The first step is always the same: your load profile. It shows which revenue lever has the greatest controllable potential for your specific consumption and feed-in behavior—and which role model fits accordingly.

Have your load profile analyzed—free and without obligation. Controllable value creation begins with data.

Request a load profile analysis now →